by
by 
It’s time for another OLTL update! This time we have more FI charts that provide a better visual of our plans and, of course, a few pictures about our experiences.
One Life To Live is our quarterly recap on how financial independence plays an integral part in fueling our true happiness. We have one life to live, but are we making the best of it? Are we living in the most fulfilling way possible? We hope that our lifestyle answers those questions as we continue to optimize for happiness. Carpe Diem!
Exploration
We kept things pretty local during the second quarter. One of my wife’s best friends got married and we spent a few days in Lancaster, PA.
We also drove to New England to visit family and for vacation. For our trip, we started with a work-sponsored conference stop in New York City for two days, then we drove to Rhode Island.
After spending a few days in Providence, RI, we made a sandwich of a trip by driving to Massachusetts to spend five days in Cape Cod and then going back to Little Rhody.
In total, we were away from home for 14 days!
Here are a few photos highlights of the New England trip.
Cape Cod, MA


Those were some of the highlights of our New England trip. We hope to be back in the Spring/Summer of next year.
So we enjoy eating out, but we also enjoy eating in. What meals did we cook last quarter?
From the chef’s kitchen
Cooking your own meals is a great way to eat healthy and save money. A great advantage is that you can cook with better ingredients and know what’s going into your food.
Here are some of the meals that we cooked last quarter.


Now for those who love numbers, we’ll proceed to discuss our basic spending, portfolio income, and performance for the second quarter.
Passive income and expenses
The following is a streamlined spending report that takes very little time to produce, therefore, giving us time back to get back to living our lives. It stays within our theme of having one life to live and maximizing our time for happiness.
What’s included in these reports?
At the end of the day, people need food, shelter, mobility, the ability to pay the bills and take care of debt payments. So, these are the expenses that we concentrate on.
Bare-bones expenses
Bare-bones spending for Q2-2018
This is how we spent on the most basic needs during the second quarter. We pull these numbers straight out of our Mint account.
Starting this quarter we’re including the year-to-date spent on categories, instead of the average spent per month. I think that seeing the YTD amount is more helpful to the readers and definitely less math for me to do. 🙂
| Category | Quarter Amount | YTD Amount | Comments |
| *Net Rent | $1,777.37 | $1,671.44 | YTD amount: We had a surplus in the first quarter and that’s why the YTD spent is less than the quarter amount. |
| Bills & Utilities | $509.79 | $1,020.10 | |
| Debt Payments | $0 | $0 | |
| Groceries | $1,236.95 | $2,751.20 | |
| Auto & Transportation | $619.98 | $1,110.59 | |
| Home Supplies | $304.10 | $660.53 | |
Total | $4,448.19 | $7,213.86 |
That sums up our bare-bone spending for last quarter. Nothing really stands out except for certain auto repairs on our 2007 Camry. We had the valve cover gasket and serpentine belt replaced along with an oil change for $350. No one likes to spend on repairs but that still beats a monthly car payment. 🙂 You can click here to see our latest annual spending.
Passive income
Dividends

Our dividend income, from index-based investments (mutual funds and ETFs), continues to increase as we accumulate more assets. We received $5,954 in income and had a 25% increase from a year ago.
Dividend income over time
I love the following chart and want to include it in our report because it shows our humble beginnings and a transition to owning our time, once we got on the FIRE path in 2012.
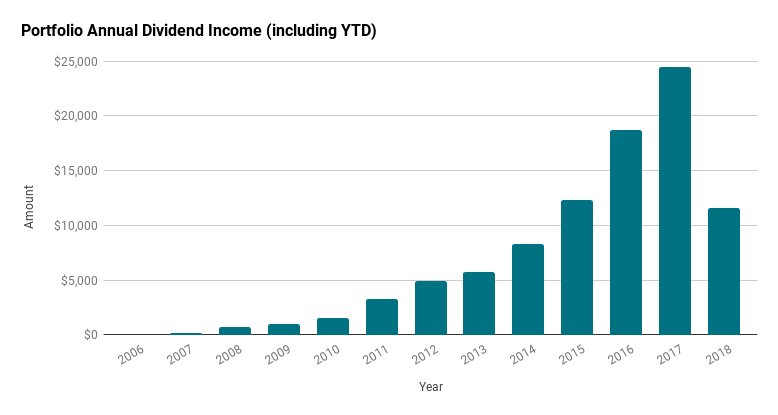
If you’re just starting out investing, you could easily see our quarterly dividend income and think: “I’m never going to get there. I’m only getting a few bucks a month in dividends. Investing is not for me. I want to get rich quick.”
Well, look where we were just twelve years ago. During the first few years, we had very little income and we didn’t even know each other back then, so those balances were even smaller in our separate accounts.
With investing you’ve got to start somewhere and, unless you’re already rich, win the lottery or get a windfall, you’re going to start with a small amount. However, no need to get discouraged! Stay focused on building income sources, investing, and enjoying the ride. The dividends will continue to accrue on their own. Start building that wealth ladder!
If you invest, they’ll come.
So the next time you start to feel discouragement, come, and look at the chart above for inspiration. 😉 We built this thing called dividend income from scratch without realizing that one day that income would fund a big chunk of our retirement!
Freedom Fund Portfolio Returns
We currently have two goals for our entire portfolio:
1) Maintain funds for a house in bonds and cash aka Nuestra Casa Fund.
2) Provide us with income for the rest of our lives aka Freedom Fund.
Last quarter we showed the entire portfolio performance, but I think that, for One To Live, it makes sense to concentrate on the Freedom Fund portion because that’s where we’re more interested in seeing how we perform in the long term.
Since we’re nearing retirement, we opted for an allocation of 75% stocks and 25% bonds/cash in the FF Portfolio, which coincides with having the money we’ll need during the first 5 years of early retirement in bonds and cash. As of now we’re leaning towards having 5-7% of our FF Portfolio in cash.
Q2 portfolio performance
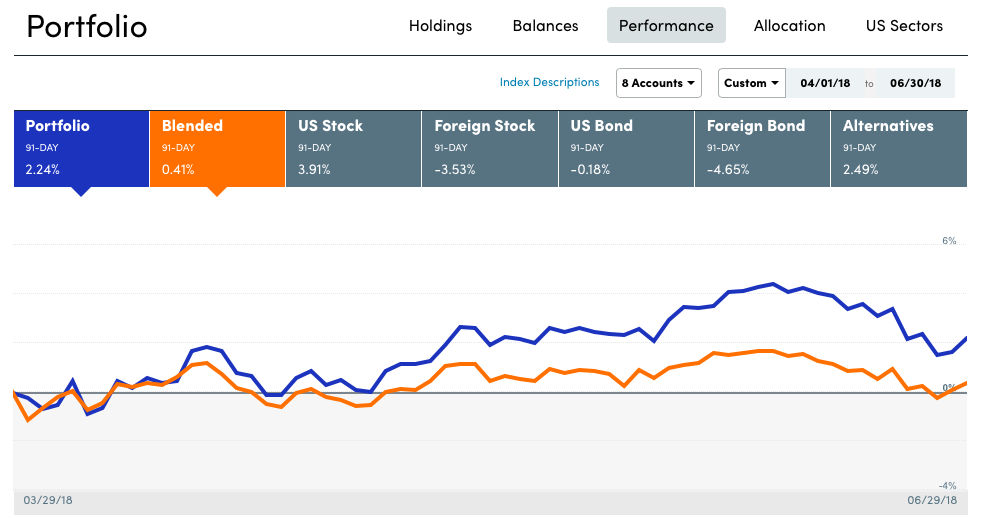
Our Freedom Fund Portfolio quarterly return was 2.24% vs. .41% for the blended allocation recommended by Personal Capital based on our risk tolerance. International stock funds and U.S. bonds were down and that kept our Freedom Fund Portfolio underperforming the S&P 500.
Freedom Fund Portfolio YTD returns
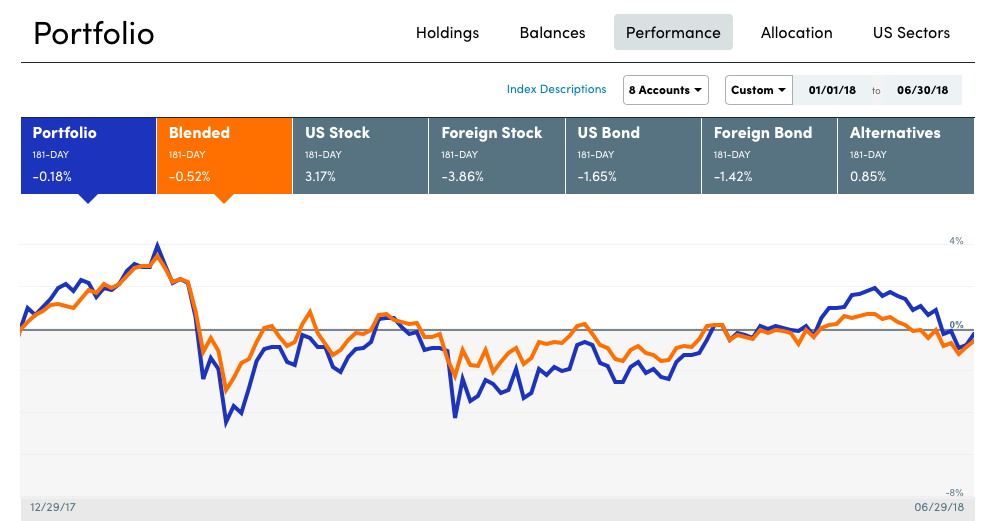
We’re pretty much flat for the year as far as performance. Maybe we’re entering the period of low returns that Jack Bogle predicted? He believes that we’ll be getting 4% annually over the next decade.
That sums up the first half of the year. We can’t control what the market does, but we can control our emotions. To be able to accomplish that, we put rationale behind our investment decisions and stick to our asset allocation, regardless of what happens in the market.
I feel really good about the financial goals that we met so far and we’re on track to surpassing them. No matter what kind of market we enter, we’ll be ready to face it head on.
Net worth update
We’re also excited to introduce some new charts! I’m always fascinated by how the income, market returns and net worth correlate, so I thought: “why not include net worth charts in OLTL?”
“OMG, you’re revealing your net worth numbers?!?”
Not really. The numbers are all relative. I also think that the exercise of analyzing these charts and how they all relate is still meaningful without having to reveal exact figures. 😉
What makes up our net worth?
We don’t count our car or material possessions as part of our net worth. Only income-producing assets make the list.
YTD net worth

The first quarter was a roller coaster ride for our net worth due to the market volatility. What helps soften the blow is the fact that we’re still contributing to our retirement accounts and brokerage accounts.
We had a better second quarter as you can see the line shooting up after March. The work bonuses helped us reach record heights in June.
Net worth over time / Our ladder to wealth
Speaking of net worth, I was shredding some documents the other day and saw a mortgage refinance application from about a decade ago. In the application there was a balance sheet that the bank uses to determine the applicant’s net worth. Excluding a small equity on the property, they estimated a negative net worth.
Isn’t that crazy?
Just 10 years ago I was showing a negative net worth on paper.
What was shocking to me is that I never paid attention to that balance sheet before. And now it was a shocker to me.
That’s because the net worth isn’t something I thought much about before. I was more focused on making money and attaining the lifestyle that I couldn’t afford before college graduation. I was more interested in a bigger income than accumulating appreciating assets. That defined much of my success. It was all about achieving the typical American Dream and working for my money. Now all I want is our money to work for us.
Financial independence is what allows us to live freely.

Even though it’s been a bull market since we merged our net worths, we’ve had all sorts of news headlines predicting Armageddon. What’s key is that we continue to invest without paying much attention to those headlines and are rewarded nicely.
We started tracking our net worth as a couple after we got married, in the beginning of 2014.
Road to retirement
We’re on track to retire as planned. The next quarters are crucial in getting things done in time for retirement. We already started to get rid of things that we won’t need, so that we don’t have to rush in the end. We want this transition to be as smooth as possible and start reducing our possessions now, since we plan to keep possessions in storage while we travel.
Funds for the next chapter in our lives
Retirement can be complicated without having money goals and not knowing how much it’s going to take to get there. So we’ve been tracking our numbers since the day we decided that we’ll retire way ahead of traditional retirement age.
As we get closer to the end, we are able to project final account balances more accurately. The chart below gives us that quick snapshot of how our accounts are doing according to our targets.

Our main financial goal now is to fatten the brokerage account in the Freedom Fund as much as possible. Realistically speaking, I don’t feel confident that we’ll hit that target by 2020, but we’ll have more than enough in our 401(k)s to compensate. The money in brokerage is what we’ll need within the first five years of early retirement, so the more we can save, the less worried we’ll be about needing to access traditional retirement accounts early.
The good news is that we have already met our target in some categories. We met our 401(k)s goal balance targets and NCF goal. Also, the Roths balances are almost complete.
The NCF funds are in a brokerage account, so we can always tap into it as a last resort before tapping into retirement accounts. So we feel pretty good about the prospects of retiring and never, ever, having the need to hold a job for income.
What’s next?
Well, this event just happened. We attended a Podtastrophe in Philly! It was a very energizing meet-up with Jonathan and Brad from ChooseFI, Gwen, and J from Fire Drill Podcast, Joe from Stacking Benjamins and the exciting FI community.
The Fire Drill podcast was started by Gwen from Fiery Millennials and J from Millennial Boss. These female millennials are rocking it, so check it out!
You know what was also so cool about this event?
Since we’re blogging anonymously, we don’t attend too many public events as bloggers, but lately, we show our identity at some of these events. For the first time, we met one of our readers who is not a blogger. Meeting someone that reads your writing it’s always a humbling experience. 🙂 Thank you for reading, Rich!
What else is happening?
We’ll also have a big surprise for you next month. So, really, stay tuned. You won’t want to miss it! 😉